
 Morocco
 Tunisia
 Europe
 Ivory Coast
 Gabon
Gabon Cameroon
 Mauritania
 Senegal
 Congo
Congo Togo
Togo Egypt
EgyptAttijariwafa bank has consolidated its position as a leading financial group and confirmed its support to clients and economies in all its countries of presence.
In 2023, Attijariwafa bank continued to roll out its new 2021–2025 strategic plan, “@MBITIONS 2025”, which is designed to accelerate the Group’s transformation in a context of significant change. The plan is based on three main ambitions:
- Strengthening Attijariwafa bank’s position as leading African banking and financial Group with the aim of creating responsible, sustainable growth both in its regions of presence as well as in new territories.
- Positioning Attijariwafa bank as an innovative, agile and “relationship-focused” bank leveraging on disruptive digital, data and AI technologies and on group synergies.
- Further alignment with the best international standards in terms of operational efficiency, risk control, compliance and ESG, to ensure a sustainable growth.
Visit our Relations Investor website
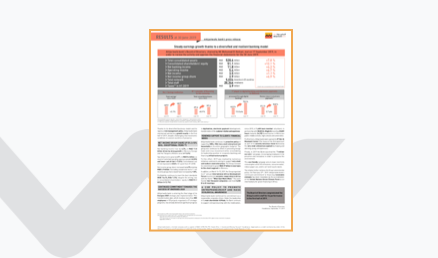
Key financial figures for Attijariwafa bank (in Billion MAD) the end of 2023
659
Total consolidated balance sheet
(+5.4%)
29,9
Net banking income
(+15,5%)
9,1
Consolidated net income
(+19,9%)
Attijariwafa bank financial results
Financial statements 2024
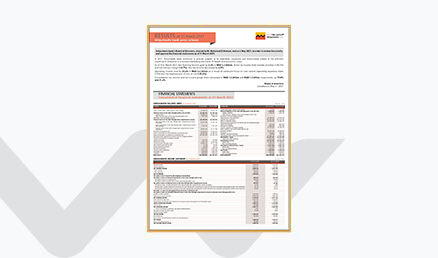
Financial results as of December 31, 2023
Results at 31 december 2021
Consolidated Accounts at 31 december 2021
Results at 31 March 2021
Results at 30 June 2021
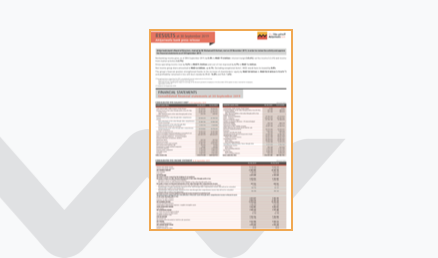
Results Presentation 30 September 2019

Results presentation 31 December 2019
Press release H1 2019
H1 2019 results
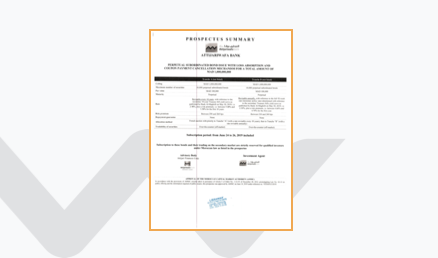
Prospectus perpetual subordinated debt june 2019
Notice of Meeting 2018
Consolidated financial statements June 2018
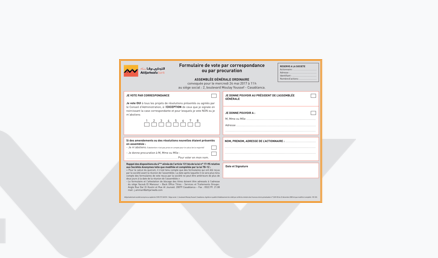
Voting form
Presentation to analysts December 2018